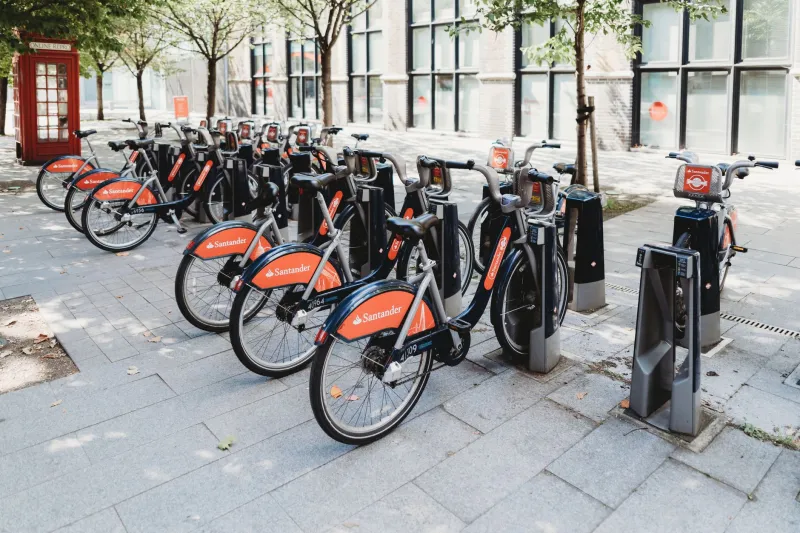
Counted Out: How Birmingham's Cyclists Keep Vanishing from the Numbers That Matter

Spend any weekday morning near the Jewellery Quarter or along the Rea Valley route and you'll see them — commuters in hi-vis, students on fixies, delivery riders threading through traffic with practised efficiency. The picture is unmistakable. Cycling in Birmingham is alive, and by most accounts it's growing. So why, when the council sits down to allocate transport funding, does the data tell a completely different story?
The answer lies in a methodological blind spot so entrenched it's practically structural. Birmingham's cycling numbers are being systematically undercounted — not through any deliberate conspiracy, but through a combination of outdated survey methods, under-resourced monitoring infrastructure, and a transport planning culture that has historically treated cycling as an afterthought. The result is a statistical fiction that shapes real decisions about where money goes and which streets get improved.
The Survey Problem Nobody Wants to Talk About
The primary tool used to assess travel behaviour in UK cities is the National Travel Survey, supplemented by local authority cordon counts — manual tallies of vehicles passing specific points at specific times. The problem with cordon counts, as anyone who's spent time digging into transport methodology will tell you, is that they're extraordinarily good at counting cars and extraordinarily bad at counting bikes.
Cars pass through defined junctions in predictable, channelled flows. Cyclists don't. They cut through parks, use canal towpaths, filter down back streets, and take routes that never intersect with a counting point. A commuter riding from Kings Heath to the city centre via the Rea Valley corridor might complete their entire journey without once passing a monitored location. As far as the data is concerned, that person doesn't exist.
Data analysts working in the West Midlands transport sector have flagged this problem repeatedly. The issue isn't just that cyclists are missed — it's that the gap between actual cycling levels and recorded cycling levels is almost impossible to quantify, which makes it very easy for decision-makers to dismiss. You can't advocate for better infrastructure on the basis of journeys that officially never happened.
What the Strava Effect Reveals
There's a growing body of evidence — much of it assembled by cycling advocacy organisations rather than official bodies — that paints a starkly different picture. Strava Metro data, which aggregates anonymised GPS activity from the app's users, has been used in several UK cities to identify high-demand cycling corridors that don't show up in traditional counts. The limitations are real: Strava skews towards recreational and sport cyclists, and its penetration among utility cyclists, older riders, and communities with lower smartphone ownership is patchy at best. But even accounting for those gaps, the divergence between Strava-derived estimates and official figures in Birmingham is striking.
Advocacy groups like Cycling UK's West Midlands branch and local campaigners have pointed to similar discrepancies in their own informal counts. Volunteer-run surveys conducted at key pinch points — the underpasses near Digbeth, the junctions around Five Ways — have consistently returned figures two to three times higher than those captured in council-commissioned assessments. That's not a rounding error. That's a different reality.
Why Planners Keep Getting It Wrong
It would be easy to frame this as negligence, but the picture is more complicated. Council transport teams are under-resourced and working with legacy systems that weren't designed with cycling in mind. The modelling software used to project future travel demand — the tools that determine which infrastructure projects get prioritised — is built on historical data. Feed it inaccurate baseline figures and it will produce inaccurate projections. The bias compounds over time.
There's also a structural incentive problem. Transport funding in the UK is largely allocated on the basis of demonstrated demand. Schemes that can show high user numbers get money; schemes that can't, don't. If cycling demand is being systematically underrecorded, cycling schemes will always appear less viable than they actually are. It's a self-reinforcing cycle — and not the good kind.
One planner, speaking informally, described it bluntly: the data environment makes it genuinely difficult to make the case internally for cycling investment, even when the evidence on the ground suggests the case is overwhelming. The numbers just don't stack up in the way the funding criteria require.
The Human Cost of Missing Data
This isn't abstract. The statistical invisibility of Birmingham's cyclists has direct consequences for the routes people ride every day. Infrastructure decisions — where to install protected lanes, which junctions to redesign, where to prioritise signal timings for cyclists — are made on the basis of these flawed datasets. Routes that are genuinely busy get deprioritised because the official record suggests they're not. Dangerous junctions go unimproved because the data undersells the number of people navigating them.
For communities where cycling is a primary mode of transport rather than a lifestyle choice — parts of Handsworth, Lozells, Sparkbrook — the stakes are particularly high. These are areas where residents cycle because they need to, not because they've bought into a particular urban identity. They're also areas where cycling infrastructure is often worst, and where the gap between what the data shows and what's actually happening on the street is arguably largest.
Fixing the Count
Solutions exist, and some cities are already implementing them. Automatic cycle counters — the kind that use inductive loops or infrared sensors embedded in the road surface — can provide continuous, year-round data that manual counts simply can't match. Bristol and Greater Manchester have invested in expanding their automatic counter networks; Birmingham's coverage remains patchy.
Better integration of third-party data sources — Strava Metro, Cycling UK's Big Bike Revival participation figures, even Transport for West Midlands' own contactless ticketing data for bike hire — could help build a more complete picture without waiting for a wholesale overhaul of survey methodology. Some transport researchers are also advocating for household travel surveys that specifically oversample cycling-heavy demographics, correcting for the under-representation of utility cyclists in existing panels.
None of this is technically difficult. What it requires is political will and a recognition that the current approach is producing a distorted picture of how Birmingham actually moves.
The Bigger Picture
Birmingham is a city in transition. The Clean Air Zone, the ongoing fallout from the council's financial difficulties, the long-term ambitions laid out in the Birmingham Transport Plan — all of these create a context in which the argument for cycling investment should be easier to make than ever. Lower emissions, reduced road congestion, public health benefits: the case stacks up on almost every metric.
But that case depends on accurate data. If the numbers that feed into funding decisions keep understating how many people are cycling — and how many more would cycle with better infrastructure — then the city will keep making the wrong calls. Money will flow towards road schemes that entrench car dependency. Cycling will remain underfunded. And the people pedalling through Birmingham every morning, invisible to the surveys, will keep wondering why nothing ever seems to improve.
The bikes are there. The riders are there. It's time the data caught up.